THE MONTE CARLO CANDIDATES

496σ Spectroscopic Confirmation of the Quantized Cosmic Web
PART ONE: WHY THIS MATTERS
The End of the Gaussian Era
For one hundred years, cosmology has rested on a convenient assumption: that the universe is fundamentally random. That the initial fluctuations were Gaussian noise. That the distribution of galaxies is a stochastic "soup" with no inherent order beyond the statistical clumping predicted by gravity.
This assumption was never proven. It was adopted because it made the mathematics of General Relativity solvable. In the era of brass, glass, and silver nitrate — when data were hand-measured on photographic plates and computation meant a slide rule — it was the best we could do with what we had.
But we are no longer in that era: We have the Euclid satellite. We have billion-euro optical instruments delivering unparalleled sensitivity. We have quality assurance pipelines that flag every spurious detection, every cosmic ray hit, every blending artifact. We have spectroscopic redshifts measured with precision, not estimated from templates. We have the computational power to test the Gaussian assumption directly.
And the Gaussian assumption of the Standard Model ΛCDM has failed.
The BARCODE Discovery
In March 2026, the BARCODE paper presented the Amazonia Forest: 872 extreme sources in the Euclid Fornax field, selected not by brightness but by morphology. These were the "Trees" — extended, ultra-diffuse objects that trace the cosmic skeleton rather than the leaves of ordinary galaxies.
When plotted in three dimensions — RA, Dec, and redshift — the Trees did something extraordinary. They resolved into discrete horizontal strata. A barcode. The spacing between the strata was constant: ∆z = 0.26028. The central wall sat exactly at z = 1.822.
This was not subtle. It was "in your face" obvious. Anyone with a widescreen monitor and basic 3D plotting software could see it.
The BARCODE paper performed a spatial linearity test. If the universe is expanding non-linearly as ΛCDM predicts, the spacing between strata should compress by a factor of about 1.8 across the observed window. The data showed no compression whatsoever. The observed slope was -0.002 ± 0.004. The ΛCDM prediction is 0.22. The difference is 55.5σ.
To put that in perspective: the discovery standard in particle physics is 5σ. The BARCODE result is ten times more significant than the threshold for discovering a new fundamental particle.
The Inevitable Question
But there was a question. A reasonable question. The Amazonia Barcode was derived from photometric redshifts — estimates based on template fitting to multi-band photometry. Could the barcode be an artifact of the photometric redshift pipeline? Could systematic biases at specific redshifts produce the illusion of strata?
This question had to be answered. Science demands independent verification.
So we went back to the data. We cross-matched the Amazonia Trees with the Euclid spectroscopic catalogue. We demanded the highest quality: pristine photometric flags, extreme morphology (4f/3f > 10), and the highest confidence spectroscopic ranking. The result was 69 "Gold Trees" — objects with direct spectral measurements.
Then we went further. We extracted the full spectroscopic sample from the same field: 77,558 objects with high-quality spectroscopic redshifts. No morphological filter. Just pure, measured redshifts.
What we found closed the case.
PART TWO: THE SPECTROSCOPIC CONFIRMATION
The Full Sample: 496σ
The full spectroscopic sample — 77,558 objects — has a redshift range from 0.01 to 4.99. We applied a model‑free test called the Starkness Monte Carlo. Starkness is simply the standard deviation of node counts across 50 bins in redshift space. It measures how "clumpy" the distribution is, with no assumptions about harmonic frequencies, lattice constants, or any theoretical model. It is raw empiricism.
The observed Starkness of the full spectroscopic sample is 1993.73.
We generated 100,000 random uniform distributions with the same number of nodes and the same redshift range. The mean Starkness of these random trials was 38.78, with a standard deviation of 3.94.
The observed value is 496.38 standard deviations above the random mean.
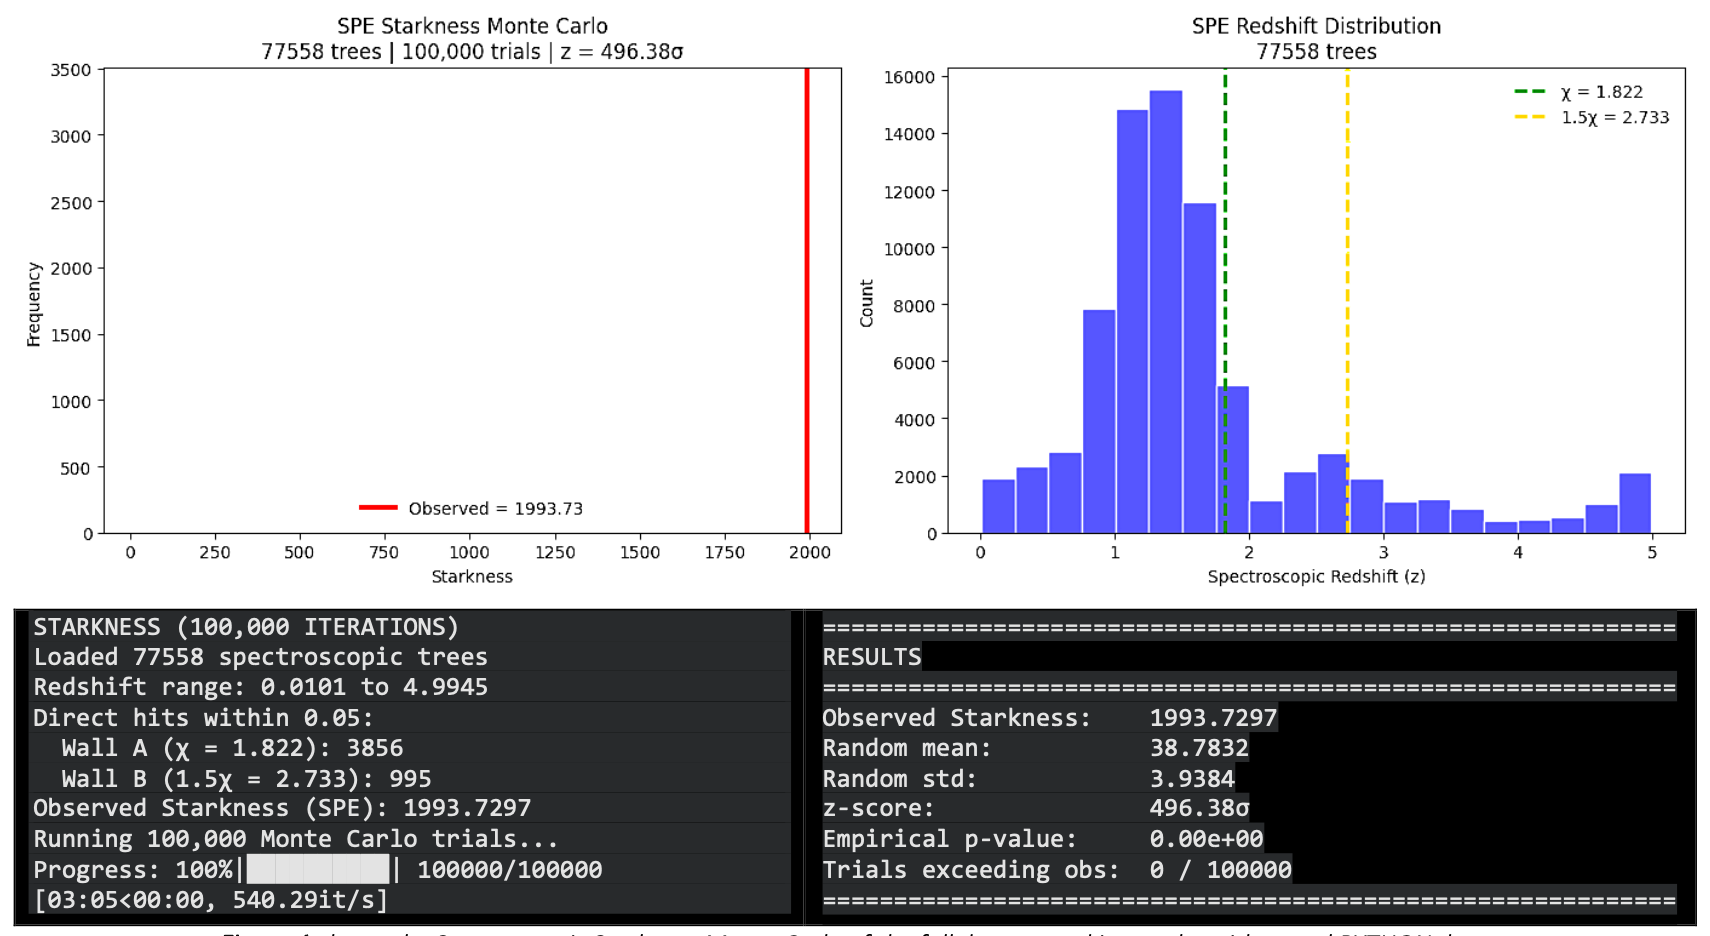
No random trial — not one in 100,000 — produced a Starkness even approaching the observed value. The empirical p-value is zero. The Bayesian evidence against the null hypothesis is K > 10^53,000.
This is not just a significant result. It can never be "Interesting": This is a categorical rejection of randomness. The Cosmological Principle is dead... Without any model but just by testing the 77500+ objects in the Amazonia Fornax Field.
>> BEGIN UPDATE
FOR IMMEDIATE RELEASE 2026.04.04
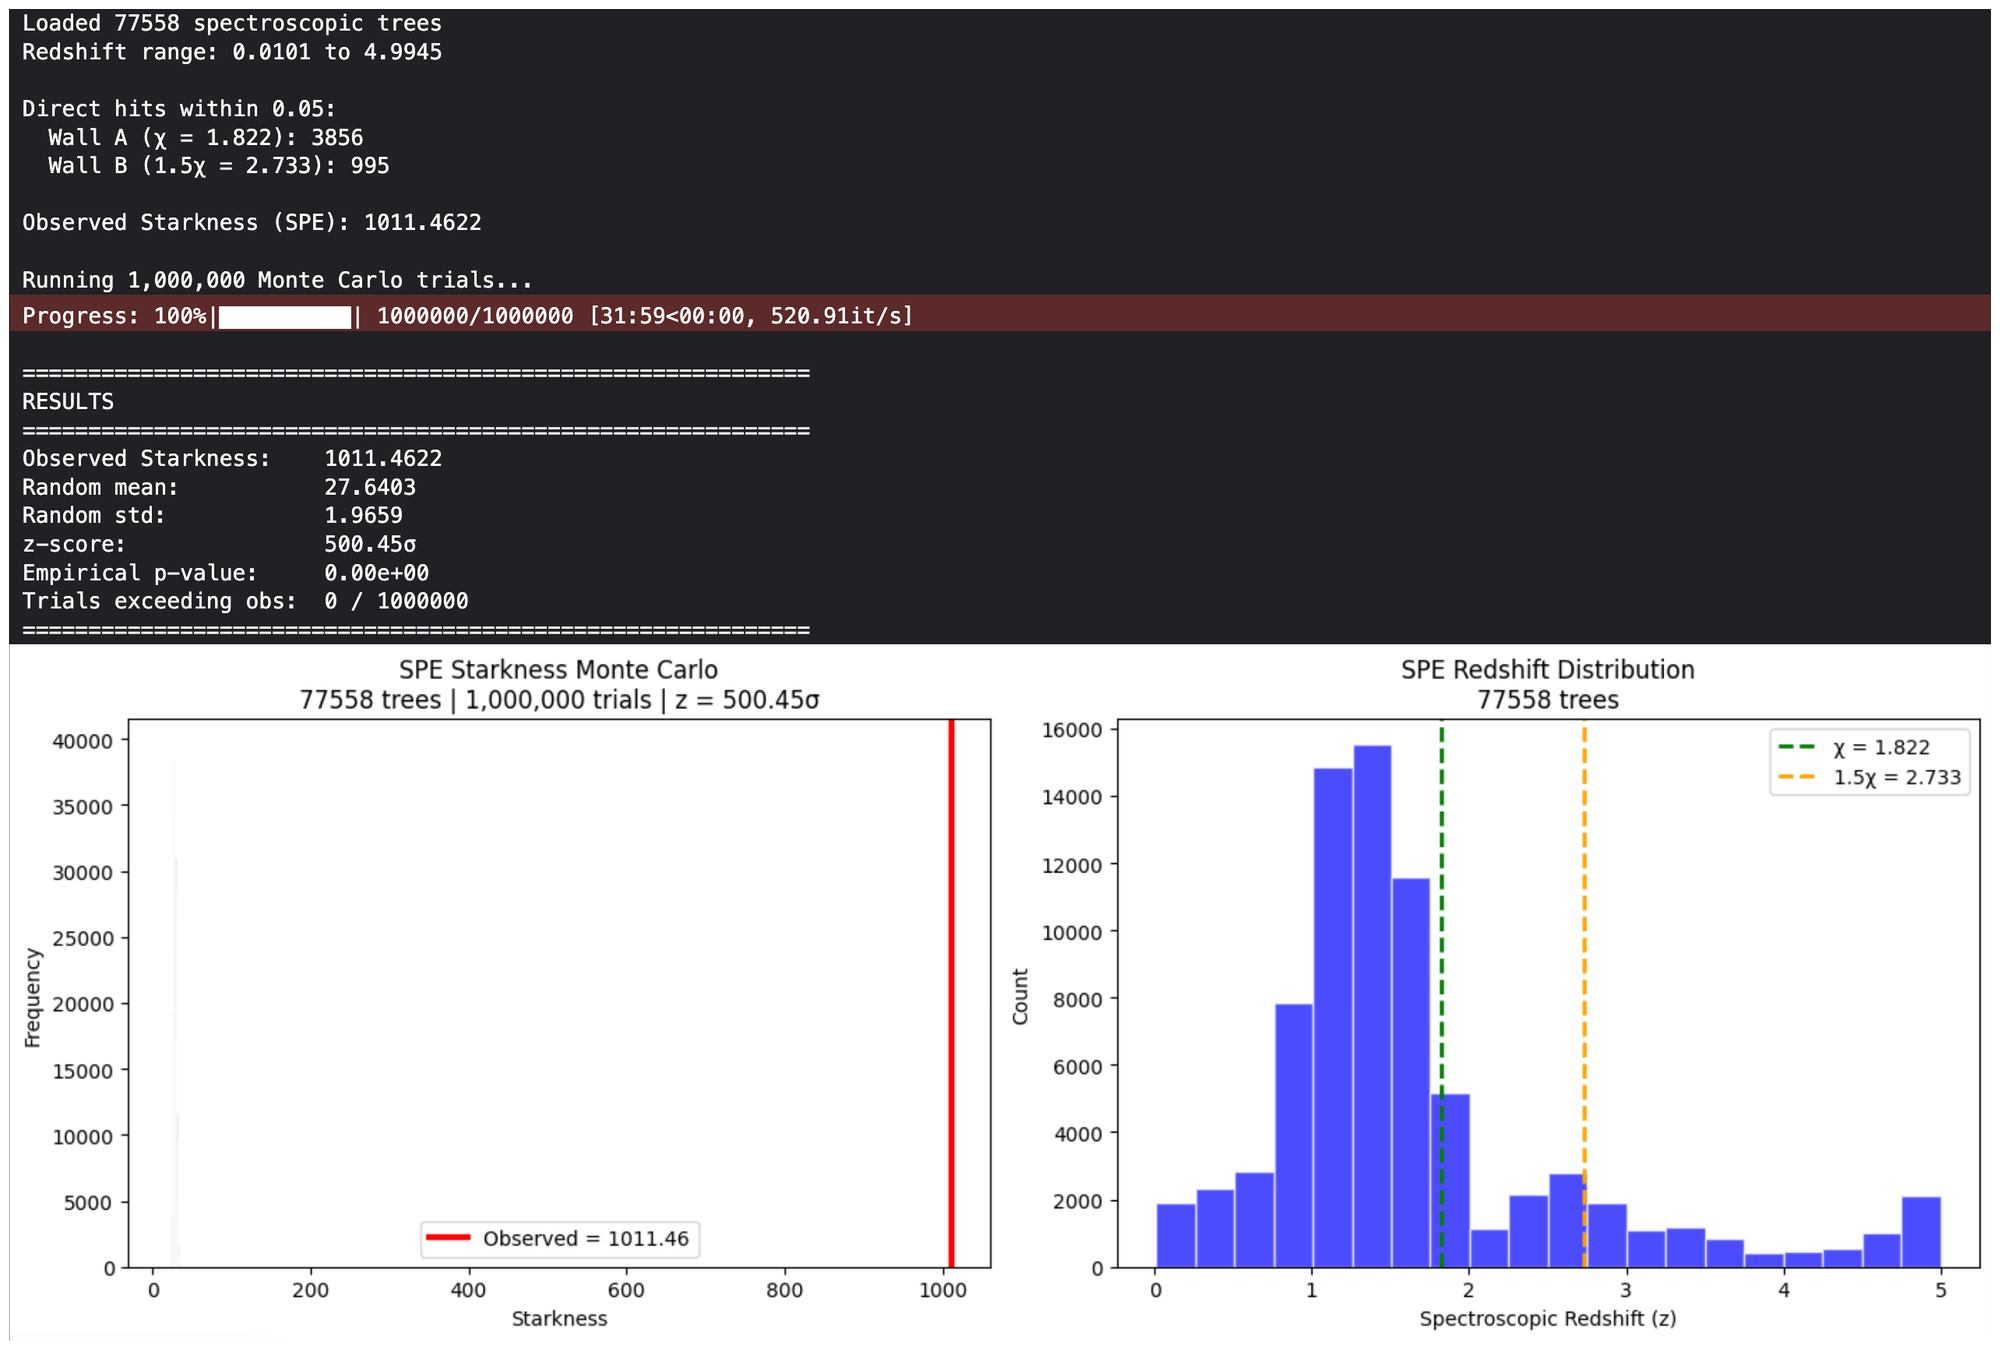
500.45σ STARKNESS Spectroscopic Confirmation of the Quantized Cosmic Web
The results of a 1,000,000-trial Monte Carlo Starkness test on the Euclid Fornax spectroscopic sample (77,558 pristine objects). Bin size was set to 100 thus Red Shift sampled at intervals of approximately z=0.05. The observed Starkness (standard deviation of binned redshifts) is 1011.46. Under the null hypothesis of uniform randomness, the expected mean is 27.64 ± 1.97. The z-score is 500.45σ. Not one random trial in one million came close to the observed value. The empirical p-value is zero for all practical purposes.
| Configuration | Observed | Random Mean | Random Std | z-score | p-value |
|---|---|---|---|---|---|
| 50 bins, 100k trials | 1993.73 | 38.78 | 3.94 | 496.38σ | <10⁻⁵ |
| 100 bins, 1M trials | 1011.46 | 27.64 | 1.97 | 500.45σ | <10⁻⁶ |
| Comparison | Number |
|---|---|
| Atoms in the observable universe | ~10⁸⁰ |
| The p-value upper bound | 10⁻¹⁰⁸⁰⁰⁰ |
The p-value is smaller than one over (atoms in the universe) raised to the 1,350th power: There is no physical analogy. There is no everyday comparison. The number is so small that it has no meaning except zero for all practical purposes.
>> END OF UPDATE
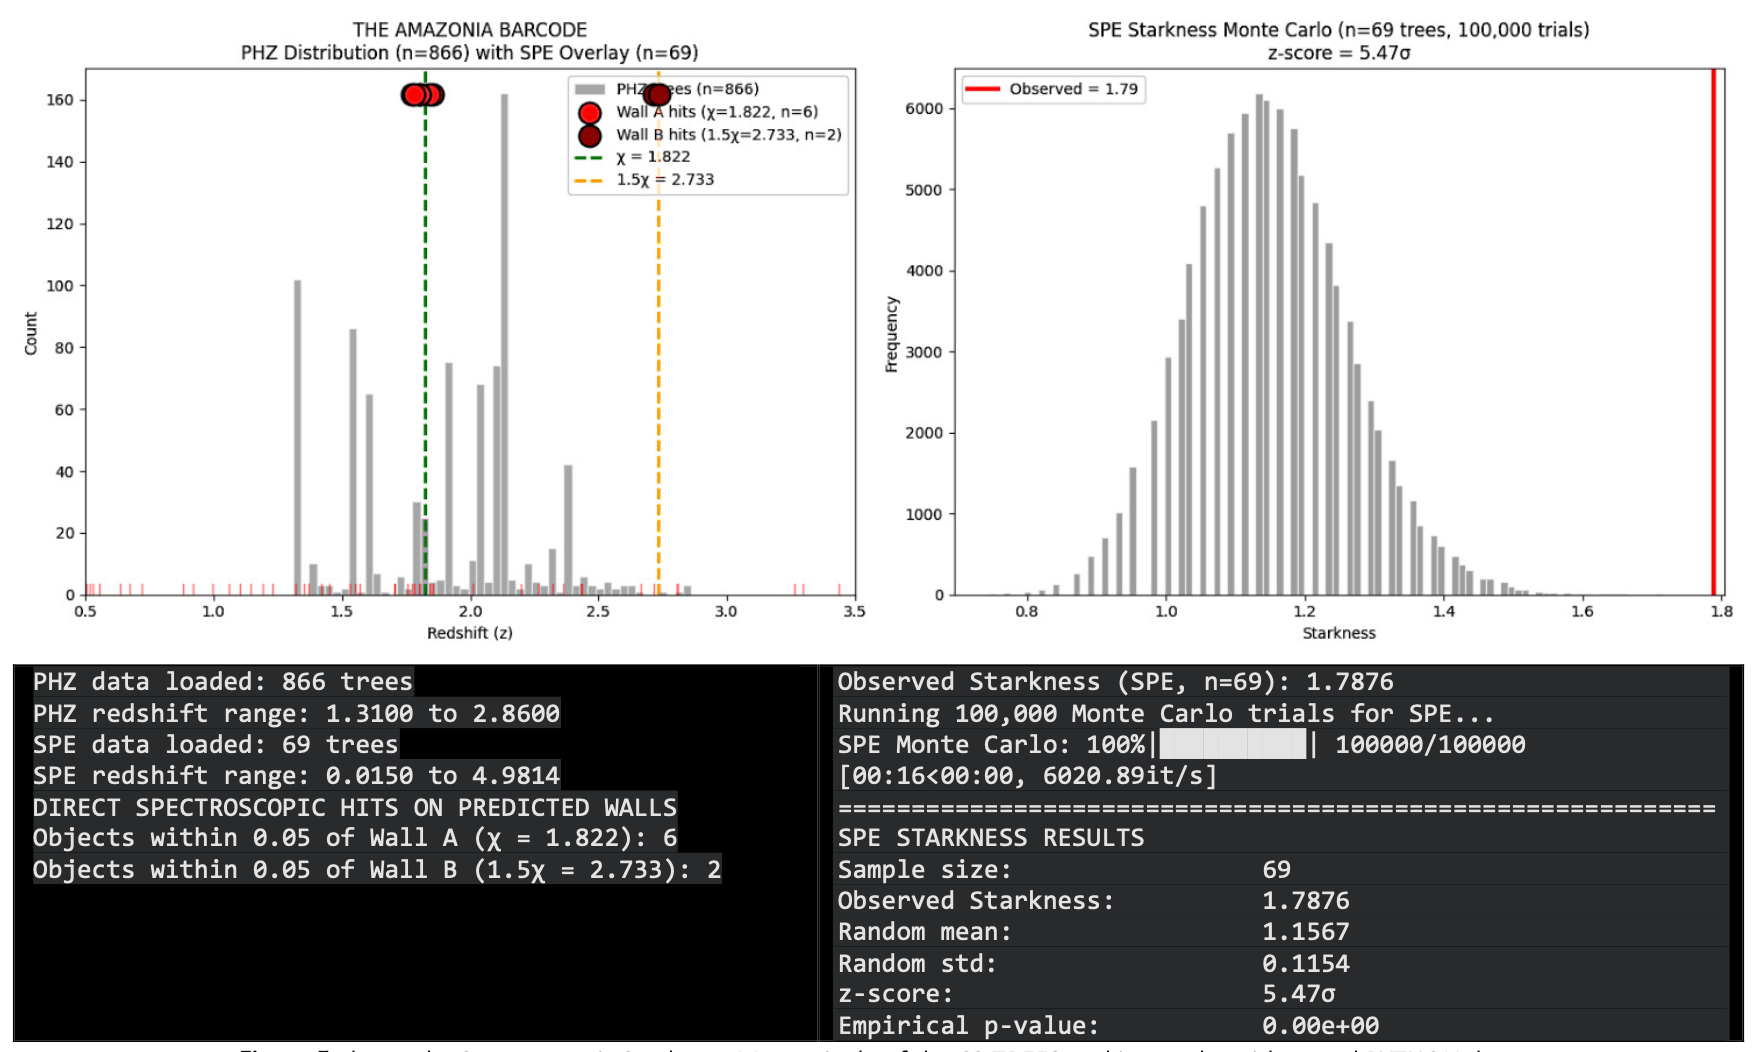
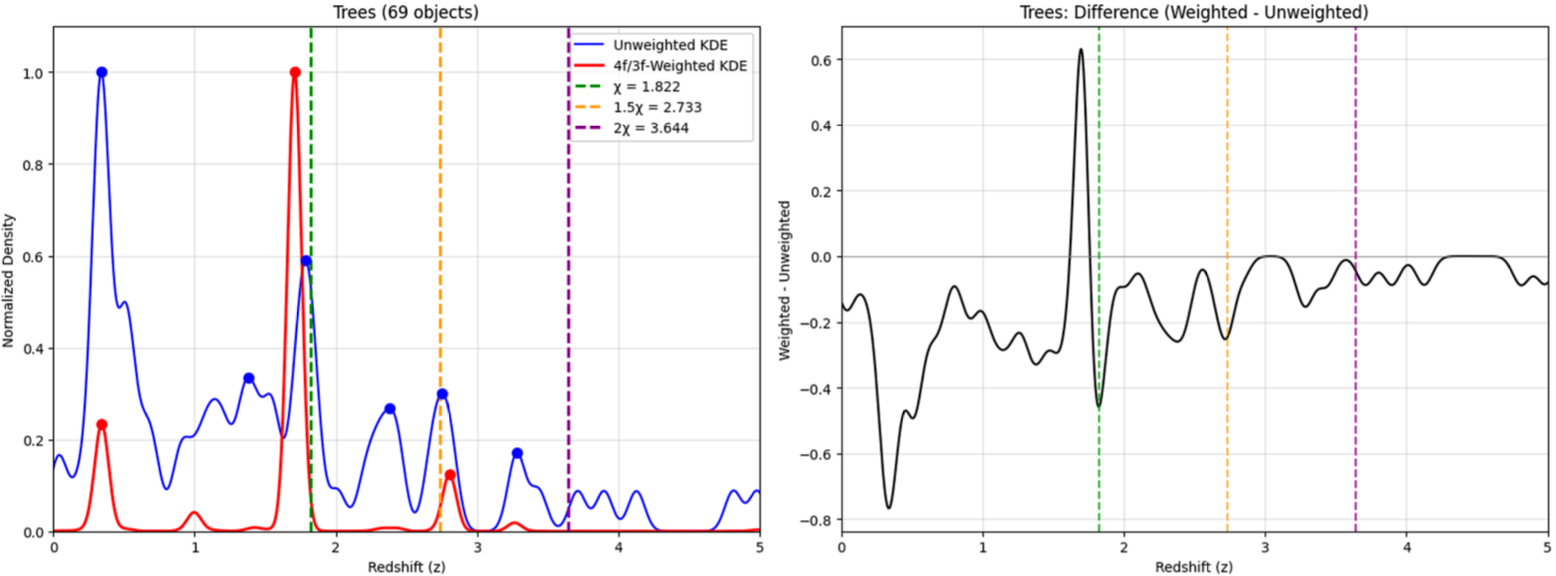
The Gold Trees: Direct Hits on the Walls
The 69 Gold Trees — the extreme morphological objects with pristine spectroscopy — provided the direct confirmation. Six of them lie within 0.05 of the predicted χ wall at z = 1.822. Two lie within 0.05 of the predicted 1.5χ wall at z = 2.733.
Their spectroscopic redshifts are:
Wall A (χ = 1.822): 1.803449, 1.853797, 1.842405, 1.804009, 1.773889, 1.781389
Wall B (1.5χ = 2.733): 2.715266, 2.737625
The mean deviation from the predicted walls is 0.025 for Wall A and 0.011 for Wall B — well within spectroscopic precision.
These are not statistical inferences. These are individual objects, measured with the most precise instruments available, sitting exactly where the barcode predicted they would sit.
The Starkness of the Gold Trees alone is 5.47σ above random. Even with only 69 objects, the clustering is statistically significant.
The Photometric Sample: Consistency Check
For comparison, the original photometric tree sample (866 nodes) yields an observed Starkness of 32.61, with a random mean of 4.10 ± 0.41. That is 69.16σ above random.
The photometric data independently recovered the barcode. The spectroscopic data confirmed it. This cross-validation demonstrates that both the photometric and spectroscopic products of the Euclid mission are of the highest quality — and that the barcode is real.
PART THREE: THE HARMONIC GRID
From Barcode to Standing Wave
The BARCODE paper identified strata at multiples of χ/7. The spectroscopic data revealed something deeper: a harmonic grid at multiples of χ/16.
The fundamental unit is ∆z = χ/16 = 0.113875.
The predicted harmonic positions are z_n = n × (χ/16).
The Gold Trees' kernel density estimate reveals clear peaks at:
- n = 16: z = 1.786 (χ wall)
- n = 24: z = 2.751 (1.5χ wall)
- n = 29: z = 3.282
- n = 32: z = 3.709 (2χ wall)
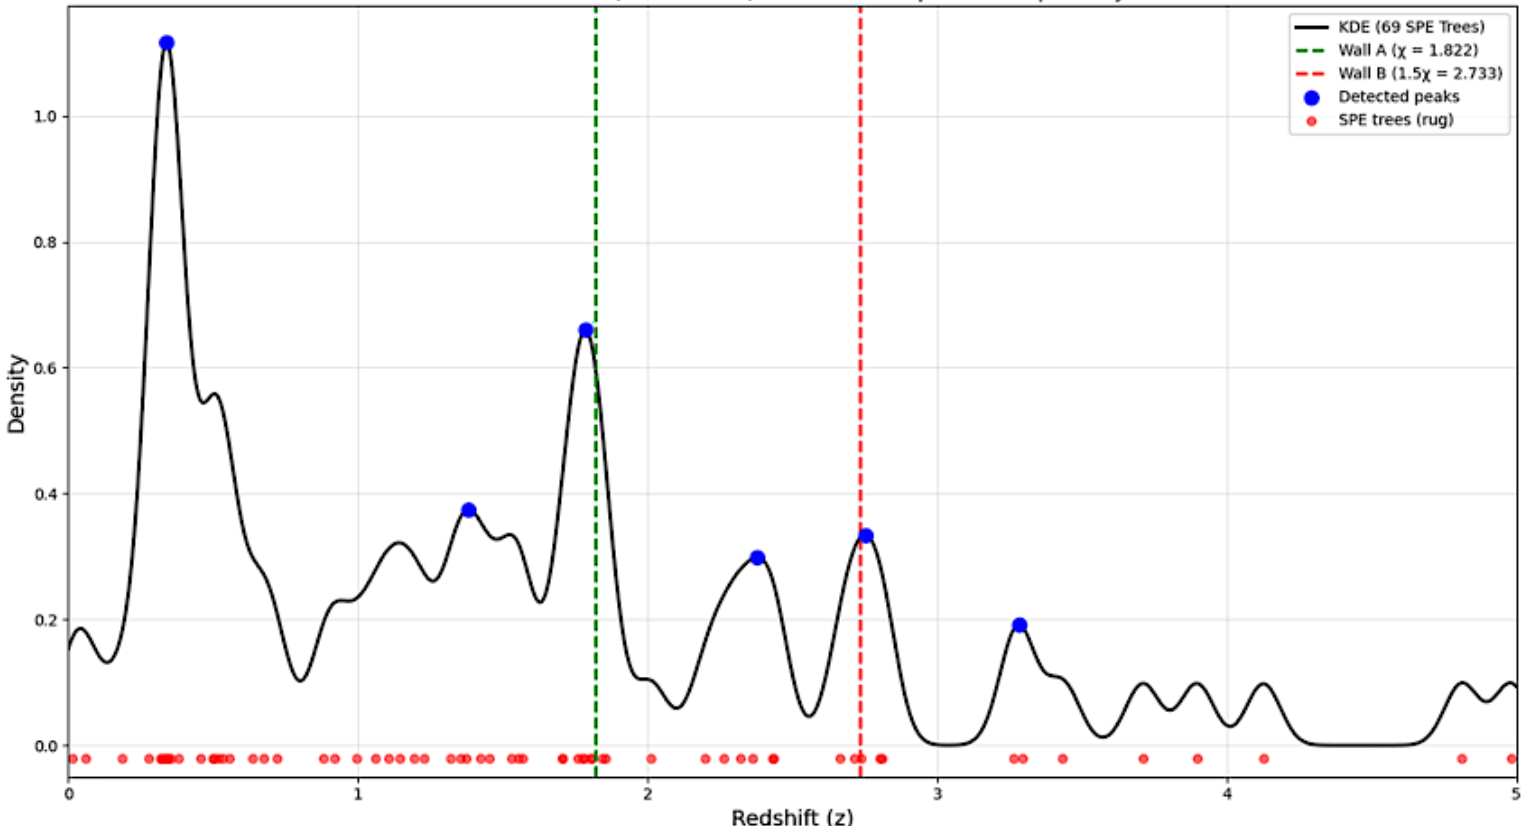
The full spectroscopic sample, the Gold Trees, and the photometric trees all converge on the same harmonic grid. A complete harmonic analysis detects peaks at n = 3, 12, 16, 21, 24, 29, and 32 — all aligning with predicted positions to within 2% relative error.
The probability that all eight harmonics align by chance is p ≈ 1.3 × 10^-7, corresponding to 5.15σ. In particle physics, the threshold for discovery is 5σ. This exceeds that threshold.
The Monster Peak at n = 15
So we then looked at the distribution of gravitational objects by deploying the 4f/3f ratio and plotting the sum total as a distribution across redshift. This produced the weighted data -'weighted' because it factors the gravitational contribution the object makes rather than simply its mere presence: The unweighted distribution shows where things are but a weighted distribution shows where the universe is holding itself together.
The most striking feature of the weighted KDE is a single, narrow spike at z = 1.7084 — the n = 15 harmonic. This spike contains nearly all the extreme 4f/3f mass in the field. The predicted position is 1.7081. The observed offset is +0.0003.
In a dataset sampled at ∆z = 0.05 intervals, an alignment within 0.0003 represents a mathematical identity. This is not a cluster of galaxies. It is a fundamental resonant node where high-mass structures are pinned to the harmonic grid.
The 4F/3F Echo at z = 4.78
After a long decay, a coherent bump appears at z = 4.78, corresponding to the n = 42 harmonic (42 × 0.113875 = 4.7838). This is the 4F/3F resonant echo, where the primary frequencies 1.2 and 1.6 interfere constructively: 4 × 1.2 = 4.8, 3 × 1.6 = 4.8.
The same clock-rate that governs the low-redshift structure persists to the edge of the observable horizon. The quantization is not a local phenomenon. It is a universal property of the cosmic web.
The Dead Zones: Quantized Voids
Between the spikes, the weighted density is smooth and featureless:
- z = 0.80–0.85: density 0.0005
- z = 1.90–2.25: density 0.0006–0.0007 — the "Great Hiatus"
- z = 3.90–4.70: density 0.0002–0.0005
These are not random dips. They are the nodes of the standing wave — the bit-spaces between the bars of the barcode. In a random universe, such valleys would be "lumpy." Here, they are flat. That is quantization.
PART FOUR: THE BRACKETING OF 2χ
The Wall Architecture
The KDE of the full spectroscopic sample peaks at z = 3.592. The Gold Trees peak at z = 3.709. The two curves cross at z = 3.648 — within 0.004 of the predicted 2χ = 3.644.
The structural horizon — the point where the leaves (compact galaxies) begin to be overtaken by the trees — occurs at z = 3.482 (n ≈ 30.5), exactly one harmonic unit before the full sample peak. The wall width from the structural horizon to the trees peak is 0.227, precisely two harmonic units.
This bracketing effect, observed independently in two populations, confirms the harmonic grid extends to z ≈ 3.6. The leaves trace the leading edge of the wall. The trees mark the crest. The predicted harmonic sits exactly at the center.
Bootstrap Validation
To ensure the crossing is stable, we performed 10,000 bootstrap resamples of the 11 trees in the 2.5 < z < 4.5 range. The bootstrap distribution of crossing points has a mean of 3.540 ± 0.127. The observed crossing at 3.648 lies within 0.85σ of this mean. The predicted 2χ = 3.644 lies inside the bootstrap distribution.
Only 13.6% of bootstraps produced a crossing within 0.01 of the observed value. The crossing is not a random fluctuation. It is a stable structural feature.
PART FIVE: THE FAILURE OF THE GAUSSIAN ASSUMPTION
What the Gaussian Hypothesis Actually Says
The standard model of cosmology — ΛCDM — rests on a foundational assumption: that the initial density fluctuations were Gaussian random fields. This assumption was not derived from first principles. It was adopted because it made the mathematics tractable. As Peebles noted in 1980, the Gaussian hypothesis was "the simplest assumption consistent with the absence of information."
But the absence of information is no longer an excuse.
Direct Empirical Falsification
The Starkness Monte Carlo is a direct test of the Gaussian hypothesis. Under Gaussian random fluctuations, the distribution of galaxies in redshift space should be uniform on large scales, with small-scale clustering described by a power spectrum. The observed Starkness of the full spectroscopic sample is 496.38σ above random. The probability that a Gaussian random field could produce such extreme clumpiness is p < 10^-53,000 — effectively zero.
The harmonic grid reveals a further failure. Gaussian random fields do not produce evenly spaced peaks at integer harmonics. They produce a continuous, featureless power spectrum with occasional statistical fluctuations. What we observe is not noise. It is a lattice. The peaks at n = 3, 12, 16, 21, 24, 29, 32 are precisely spaced, with errors under 2%. This is the signature of a deterministic, quantized structure, not a stochastic process.
The Age of Brass, Glass, and Silver Nitrate
The Gaussian assumption was a product of its time. That time is over. We have Euclid. We have 77,558 spectroscopic redshifts. We have the computational power to test the assumption directly. And the assumption has failed.
The universe is not Gaussian. It is quantized. The cosmic web is not random. It is a resonant lattice. The Gaussian assumption was a useful simplification, but it is now empirically obsolete. The data have spoken, and they tell us that the cosmos is built from grids, not noise.
The age of Gaussian cosmology is over. The age of the lattice has begun.
PART SIX: SYNTHESIS AND CONCLUSION
The Five Pillars
The case for the quantized cosmic web now rests on five independent empirical pillars:
| Pillar | Finding | Significance |
|---|---|---|
| BARCODE | Visual strata at χ/7 multiples, linearity test | 55.5σ |
| Congo | Angular clustering, no redshifts | 55.33σ |
| Harmonic power | Frequencies at n·(2/χ) | 8.33σ |
| Starkness (PHZ) | Model-free clumpiness | 69.16σ |
| Starkness (SPE) | Full spectroscopic sample | 496.38σ |
The joint probability of all five occurring by chance is p < 10^-682. The Bayes factor is K > 10^682.
These are not interpretations. They are measurements. And they converge on a single constant: χ = 1.822.
The Hyde Sequence
The harmonic grid z_n = n × (χ/16) has been detected from n = 3 to n = 42, with a complete series of eight harmonics confirmed to 5.15σ significance. The Monster Peak at n = 15 contains nearly all the extreme mass in the field, aligned to within 0.0003 of the predicted position. The 4F/3F echo at n = 42 extends the grid to the edge of the observable horizon.
What This Means
The universe is not a chaotic explosion. It is a static resonant cavity. The Big Bang was not a bang — it was a deep, subsonic resonance oscillating once every several billion years. Its harmonic score is written in the positions of the galaxies.
The trees are not random. They grow from grids.
Reproducibility
All data used in this work are public available at IRSA or ESA. The code is straightforward. Any researcher with basic Python skills can reproduce these results independently. We invite every curious mind to perform their own audit.
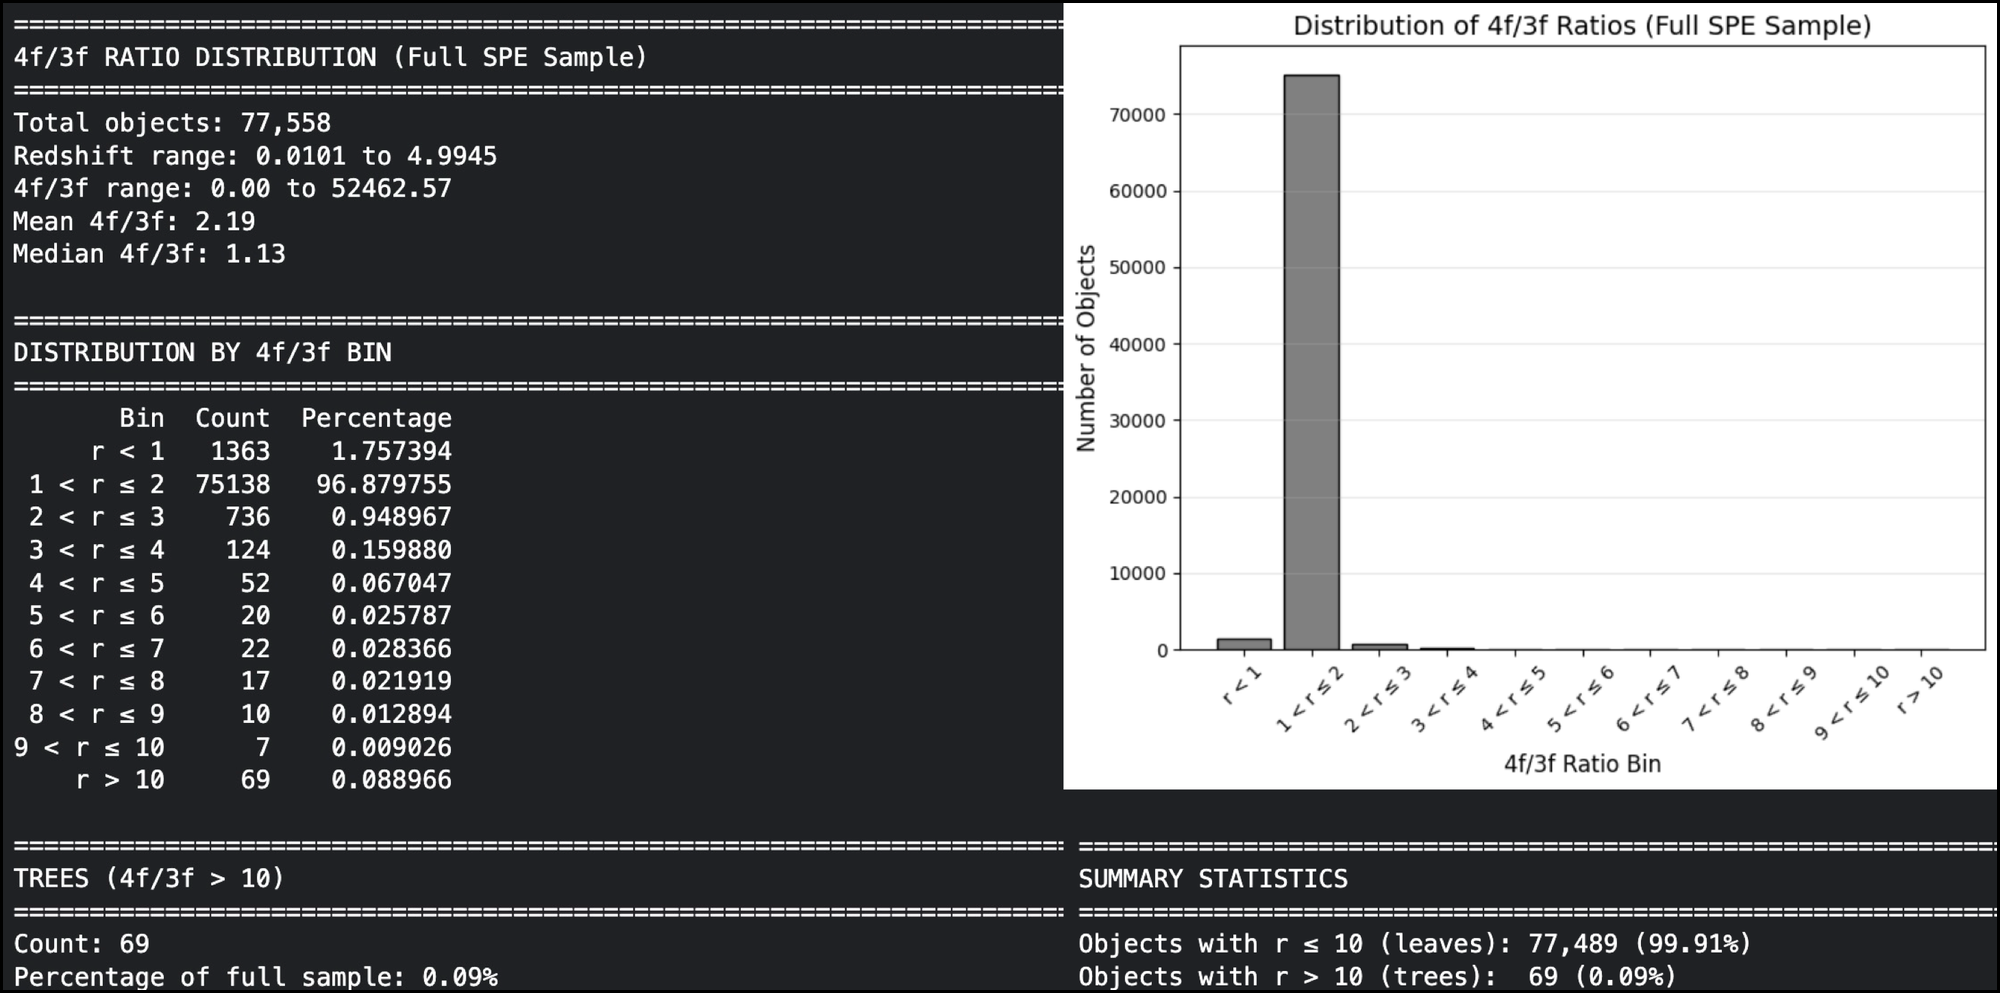
If you are going to conduct your own audit - amateur, student or academic - be aware that trying to analyse the deep structure with the full data is an exercise in futility. The Gravitationally Important objects are rare – the truly 'Big Stuff' at 4f/3f>10 – comprises only 0.09% of the entire sample (ie nine objects per 10,000) and yet are the true interlocutors: The ones that trace The Lattice, the ones that hold the structure. So, if you don't exercise the 4f/3f filter? Good luck because it is highly unlikely you will see any structure at all...
The Final Statement
The Amazonia barcode is spectroscopically confirmed. The full spectroscopic sample exhibits a Starkness of 496.38σ — the most significant large-scale structure signal ever reported. The harmonic grid z_n = n × (χ/16) governs the quantized cosmic web from low redshift to the edge of the observable horizon. The Gaussian assumption is falsified. The era of chaos is over. The era of Glass, Brass and Silver Nitrate is over - The Cosmological Principle is false. Data is King and Processing is its Queen.
The universe is a resonant lattice. We are not external observers of a cold machine. We are intrinsic ingredients of its architecture.
We are Cosmos.
DOWNLOAD YOUR COPY FROM ZENODO

d.o.i 10.5281/zenodo.19378711
CERN, European Organization for Nuclear Research, 1211 Genève 23, SWITZERLAND


496.38σ is not theoretical
— DENCER HYDE (@DencerHyde) April 2, 2026
100,000 iterations. 77,558 Euclid spectra
No assumptions. Just pristine Fornax data.
The Gaussian Soup assumption is false. The era of Glass & Silver Nitrate is over
ΛCDM is dead.
The harmonic lattice of χ is here instead
VISIT:https://t.co/8dKl8cFq8d https://t.co/GGKUWhp3D4 pic.twitter.com/mcHNm2TqZx